A Players vs. B Players at Work: Two Types of Talent
Create Your Resume Now
A players are high performers. The workplace superstars.
They push performance from good to great, climb the highest mountains and earn fortunes.
They’re the geese that lay golden eggs, the boss’s pets, and bring out the green-eyed monster in their colleagues.
They make the best deals, but not best friends at work. And they love to make a fuss. Because they know they can.
There are also B players. And stereotypes would have it that “B” stands for the background, where they belong.
Do you like the picture of a black-and-white workplace where “us” and "them” are from different leagues? Your answer might depend on whether you’re an A or B player yourself.
But let’s pause the A/B battle and get back to reality.
Let’s analyze some recent data to set the stage.
- According to McKinsey’s 2023 State of Organizations report, the highest performers are 800% more productive than average performers in the same role.
- Gallup’s State of the Global Workplace 2023 Report reported that only 23% of employees are engaged at work. And the disengaged 77% cost the world $7.8 trillion in lost productivity annually.
- Quantum Workplace’s 2023 Employee Engagement Trends Report on employee trends revealed that a lack of recognition is among the top 3 reasons people leave their jobs. And employees who believe they’re recognized are 2.7 times more likely to be highly engaged.
To dive into the reality of workers, with all its shades, complexities, and nuances, we surveyed over 1000 employees and examined:
- The workplace dynamics of A players and B players
- The role of motivation and recognition at work
- Top workplace strengths and weaknesses
- How satisfied employees are with chosen aspects of their professional life
- Attitudes to mental health and work-life balance
- Professional life priorities and dilemmas employees share
- Views on A players and B players at work
Key findings:
- 8 in 10 participants claim being an A or B player is a matter of motivation.
- 55% think that A players have an overestimated impact.
- 76% claimed B-player employees were neglected, compared to A players.
- 79% feel their manager takes them for granted.
- 75% would sacrifice their romantic relationship/marriage for a successful career.
- 72% would choose job satisfaction over job prestige.
- For 26%, their key motivational factor is enjoying their job.
- Only 38% take pride in their professional achievements.
- For both A and B players, giving up easily and sensitivity to criticism are the top workplace weaknesses.
But that’s not all. Keep reading to discover what else we uncovered in our ultimate A/B test.
A players & B players: unveiling the workplace dynamics
Let’s go back to the year 2003.
That’s when Thomas DeLong, a professor at Harvard Business School, defined B players as the middle 80% of a company’s workforce who are neither the superstars (the A’s) nor the weakest links (the C’s). Since then, there have been further studies on the topic. But, for the most part, the share of B players remains the same. So most career experts agree with DeLong to this day.
In our study, we wanted to confront this data with how people viewed themselves and which type of employee they identified with. What’s worth noting, the terms “A player” and “B player” did not appear in the survey. Thanks to various research methodology tricks, while collecting the data, we avoided bias. After all, it might be tempting for the participants to join the “A–team.” No matter whether it reflects their actual type.
But—
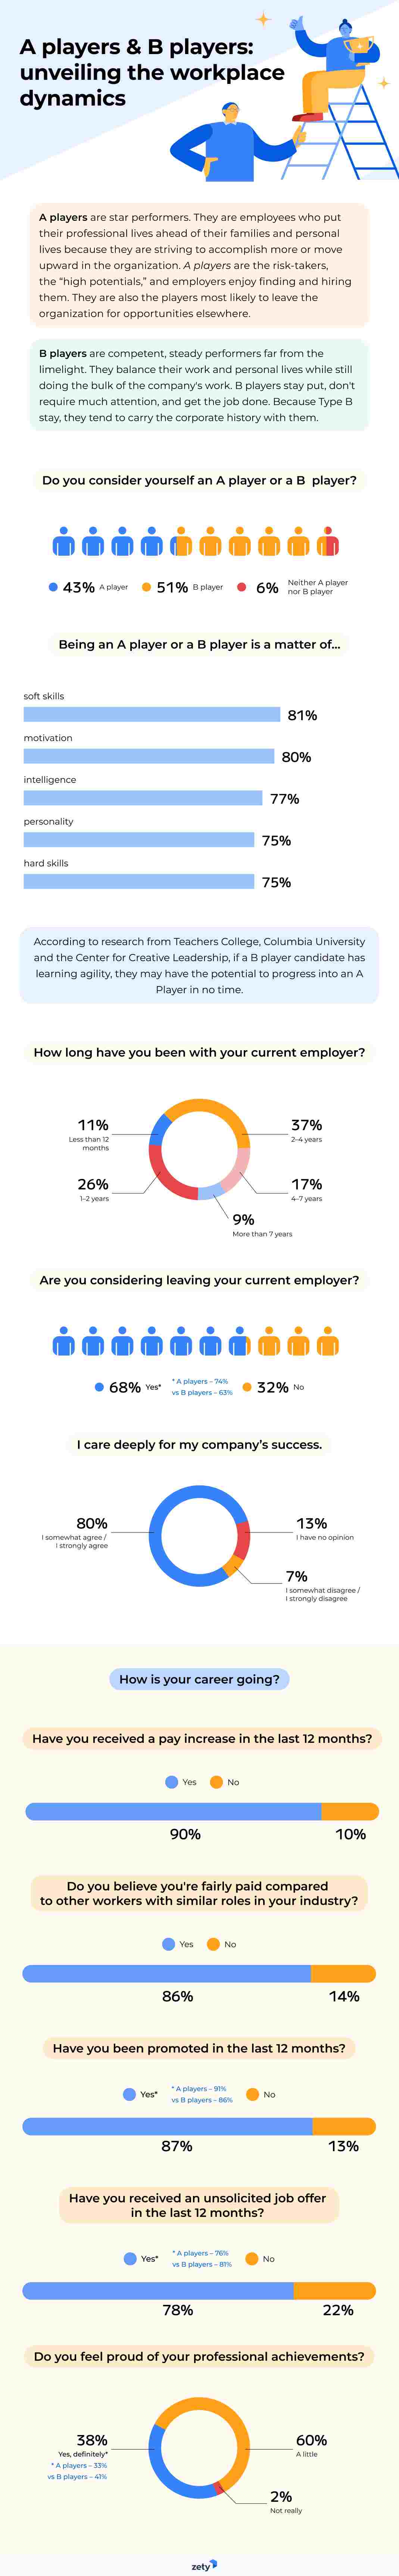
Before we reveal the results, let’s describe the two main types of employees.
★★★
Time to get back to our study.
It seems that something might have changed since 2003. At least with how workers see themselves.
Let’s dig deeper. The biggest share of respondents identifying as A players were Independents (54%), people with work experience of over 11 years (51%), and workers in companies employing 201–500 people (47%).
Conversely, participants with an annual income of $50,000–74,999 (58%), Republicans (57%), Master’s/Doctorate degree holders (55%), and blue-collar workers (54%) showed the strongest tendency to classify themselves as B players.
Survey takers without a college degree (18%) and those working hybrid (18%) work gave the highest percentage of “Neither A player nor B player” answers.
What determines if a person is an A or B player? Let’s find out.
Interestingly, there also were noteworthy disparities in answers given within demographic groups. Here’s the full breakdown of the data:
- Being an A player or a B player is a matter of soft skills—81%.
Age: 25 or younger—90% vs. 26–40—76%
Industry: software/IT—90% vs. education—71%
Work experience: 11 years or more—88% vs. 1–2 years—69%
Company size: 501+ employees—95% vs. 1–10 employees—68%
Annual income: $75,000 or more—89% vs. $25,000 or less—64%
Education: Master’s/Doctorate degree—86% vs. no college degree—64%
Political affiliation: Republicans—83% vs. Independents—69%
- Being an A player or a B player is a matter of motivation—80%.
Age: 25 or younger—87% vs. 41 or older—79%
Industry: software/IT—86% vs. business & finance—74%
Work experience: 6-10 years—88% vs. 1–2 years—69%
Company size: 501+ employees—89% vs. 1–10 employees—65%
Annual income: $50,000 or more—85% vs. $25,000 or less—64%
Education: Master’s/Doctorate degree—86% vs. no college degree—54%
Political affiliation: Republicans—85% vs. Independents—71%
- Being an A player or a B player is a matter of intelligence—77%
Age: 25 or younger—88% vs. 41 or older—75%
Industry: software/IT—86% vs. education—63%
Company size: 501+ employees—91% vs. 1–10 employees—50%
Annual income: $75,000 or more—84% vs. $25,000 or less—62%
Education: Bachelor’s/Associate degree—82% vs. no college degree—50%
Political affiliation: Republicans—83% vs. Independents—62%
- Being an A player or a B player is a matter of personality—75%.
Industry: software/IT—85% vs. business & finance | education—69%
Company size: 501+ employees—95% vs. 1–10 employees—53%
Annual income: $50,000 or more—80% vs. $25,000 or less—57%
Education: Master’s/Doctorate degree—83% vs. no college degree—52%
Political affiliation: Republicans—78% vs. Independents—62%
- Being an A player or a B player is a matter of hard skills—75%.
Age: 25 or younger—82% vs. 41 or older—72%
Industry: software/IT—84% vs. business & finance—68%
Work experience: 6–10 years—85% vs. 1–2 years—67%
Company size: 501+ employees—82% vs. 1–10 employees—54%
Annual income: $75,000 or more—85% vs. $25,000 or less—61%
Education: Master’s/Doctorate degree—79% vs. no college degree—49%
Political affiliation: Republicans—79% vs. Independents—70%
As you can see, views vary depending on many factors.
Something to consider. Being a B player isn’t set in stone.
Moving on, we also asked questions to examine how the survey takers' careers were progressing. In each case, we compared the answers of those who identify as A or B players. Here’s what we found out.
In the last 12 months:
- 90% of participants have received a pay increase.
- 87% have been promoted. [A players – 91% vs. B players – 86%]
- 78% have received an unsolicited job offer. [A players – 76% vs. B players – 81%]
Additionally—
- 86% believed they were paid fairly compared to other workers with similar roles in their industry. The study didn’t reveal any noticeable differences within demographic groups.
- 8 in 10 deeply cared for their company's success.
The next piece of data may be surprising in light of the above findings.
- 78% of survey takers admitted they were considering leaving their current employer. The percentage was larger for A players than for B players – 74% vs. 63%, respectively.
Why is that? If pay rises and promotions don’t have enough power to retain an employee, what does? The findings in the following sections of this article will provide the answers. Stay tuned.
Let’s dive deeper. Respondents also shared if they felt proud of their professional achievements. Their answers were as follows:
- Yes, definitely – 38%
- A little – 60%
- Not really – 2%
Surprisingly enough, A players – the workplace superstars – were less proud of themselves than B players—33% vs. 41%, conversely.
Another myth busted. High performers don’t have to be big-headed, arrogant, and crazy about hyper-productivity.
Now let’s examine the role of motivation and praise at work.
The role of motivation & recognition at work
In the next section of the survey, we focused on what inspires participants at work. They chose up to two factors they considered most important.
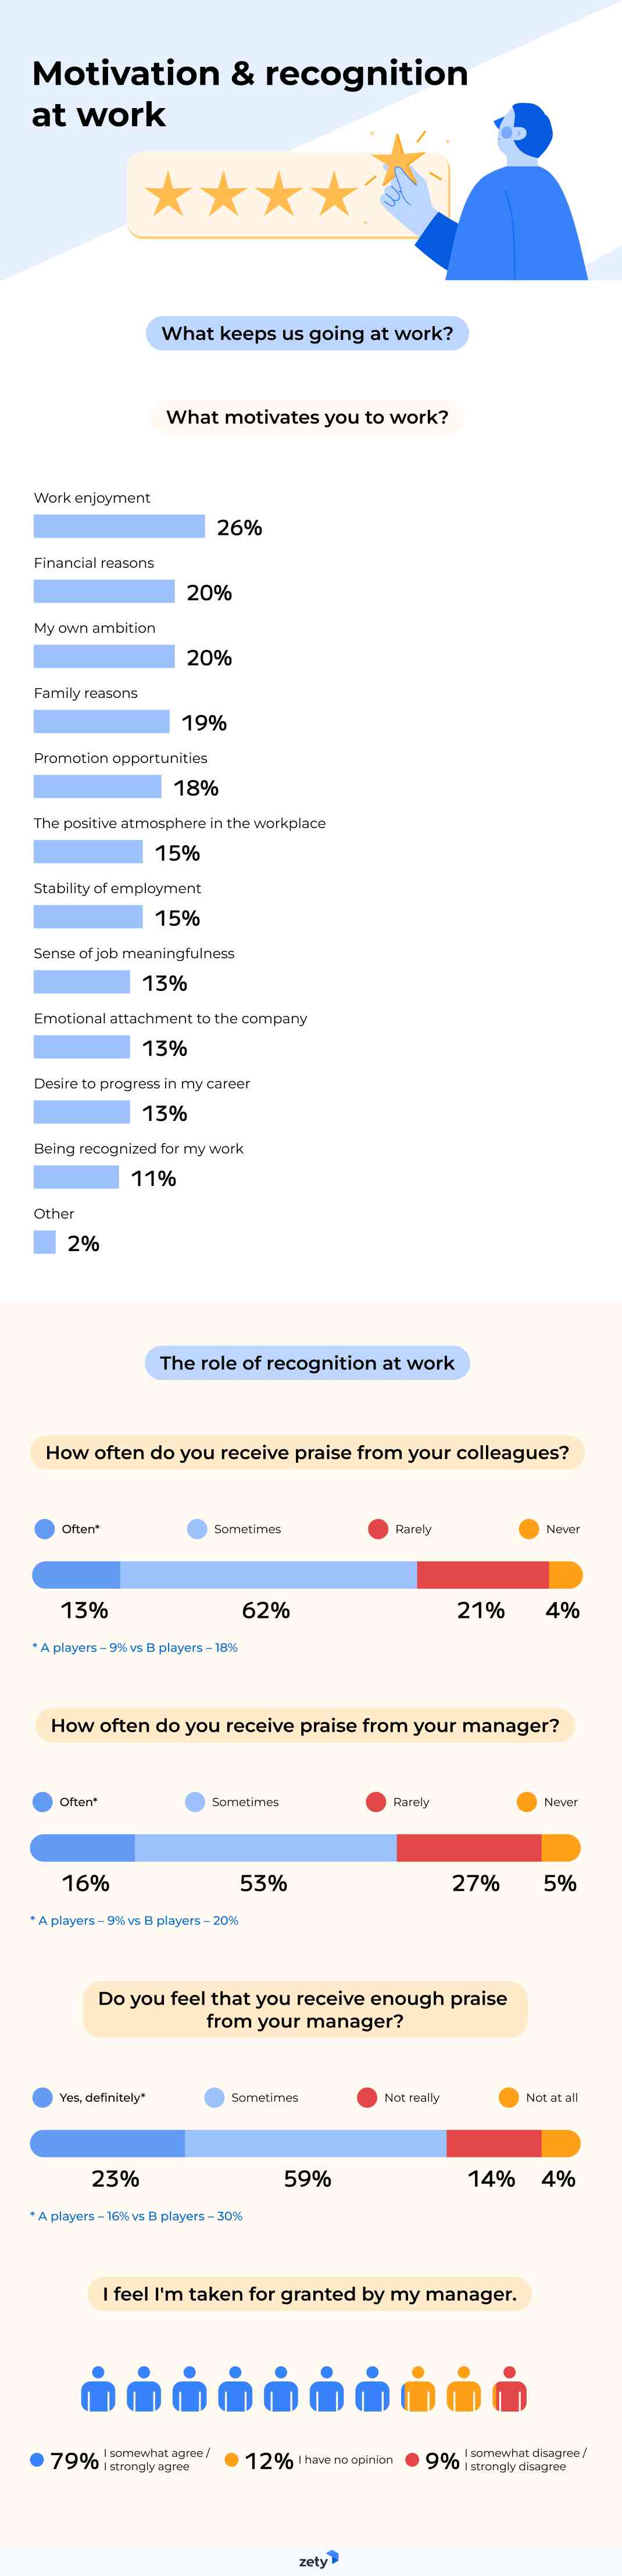
What motivates you to work?
- Work enjoyment – 26% [B players – 29% vs. A players – 23%]
- Financial reasons – 20%
- Personal ambition – 20%
- Family reasons – 19%
- Promotion opportunities – 18%
- Having a positive atmosphere in the workplace – 15%
- Stability of employment – 15%
- Sense of job meaningfulness – 13%
- Emotional attachment to the company – 13%
- Desire to progress in my career – 13%
- Being recognized for my work – 11%
- Other – 2%
Work enjoyment, financial reasons, and personal ambition were the top motivational factors, as you see.
Although only 11% of respondents chose getting recognition for their work as a crucial contributor, the role of receiving praise is hard to overstate.
We all want to be appreciated – in the workplace and beyond. Recognition makes employees more motivated, productive, and eager to cooperate. It also gives them a sense of accomplishment and encourages consistent high-level performance.
Next, we asked participants about workplace recognition.
How often do you receive praise from your colleagues?
- Often – 13% [A players – 9% vs. B players – 18%]
- Sometimes – 62%
- Rarely – 21%
- Never – 4%
How often do you receive praise from your manager?
- Often – 16% [A players – 9% vs. B players – 20%]
- Sometimes – 53%
- Rarely – 27%
- Never – 5%
Do you feel that you receive enough praise from your manager?
- Yes, definitely – 23% [A players – 16% vs. B players – 30%]
- Sometimes – 59%
- Not really – 14%
- Not at all – 4%
Surprisingly, B players claimed to be praised approximately twice as often as A players, both by their colleagues (18% vs. 9%) and their managers (20% vs. 9%). But our high-maintenance A players were noticeably less satisfied with the amount of praise they received than B players (16% vs. 30%).
Moreover, almost 8 in 10 (79%) participants felt taken for granted by their manager.
Kind words cost nothing but have tangible benefits. The more valued the employees, the more positive the atmosphere in the company. Everybody wins as it contributes to the overall success of the organization.
Workplace strengths & weaknesses
Let’s have a look at workplace strengths and weaknesses now.
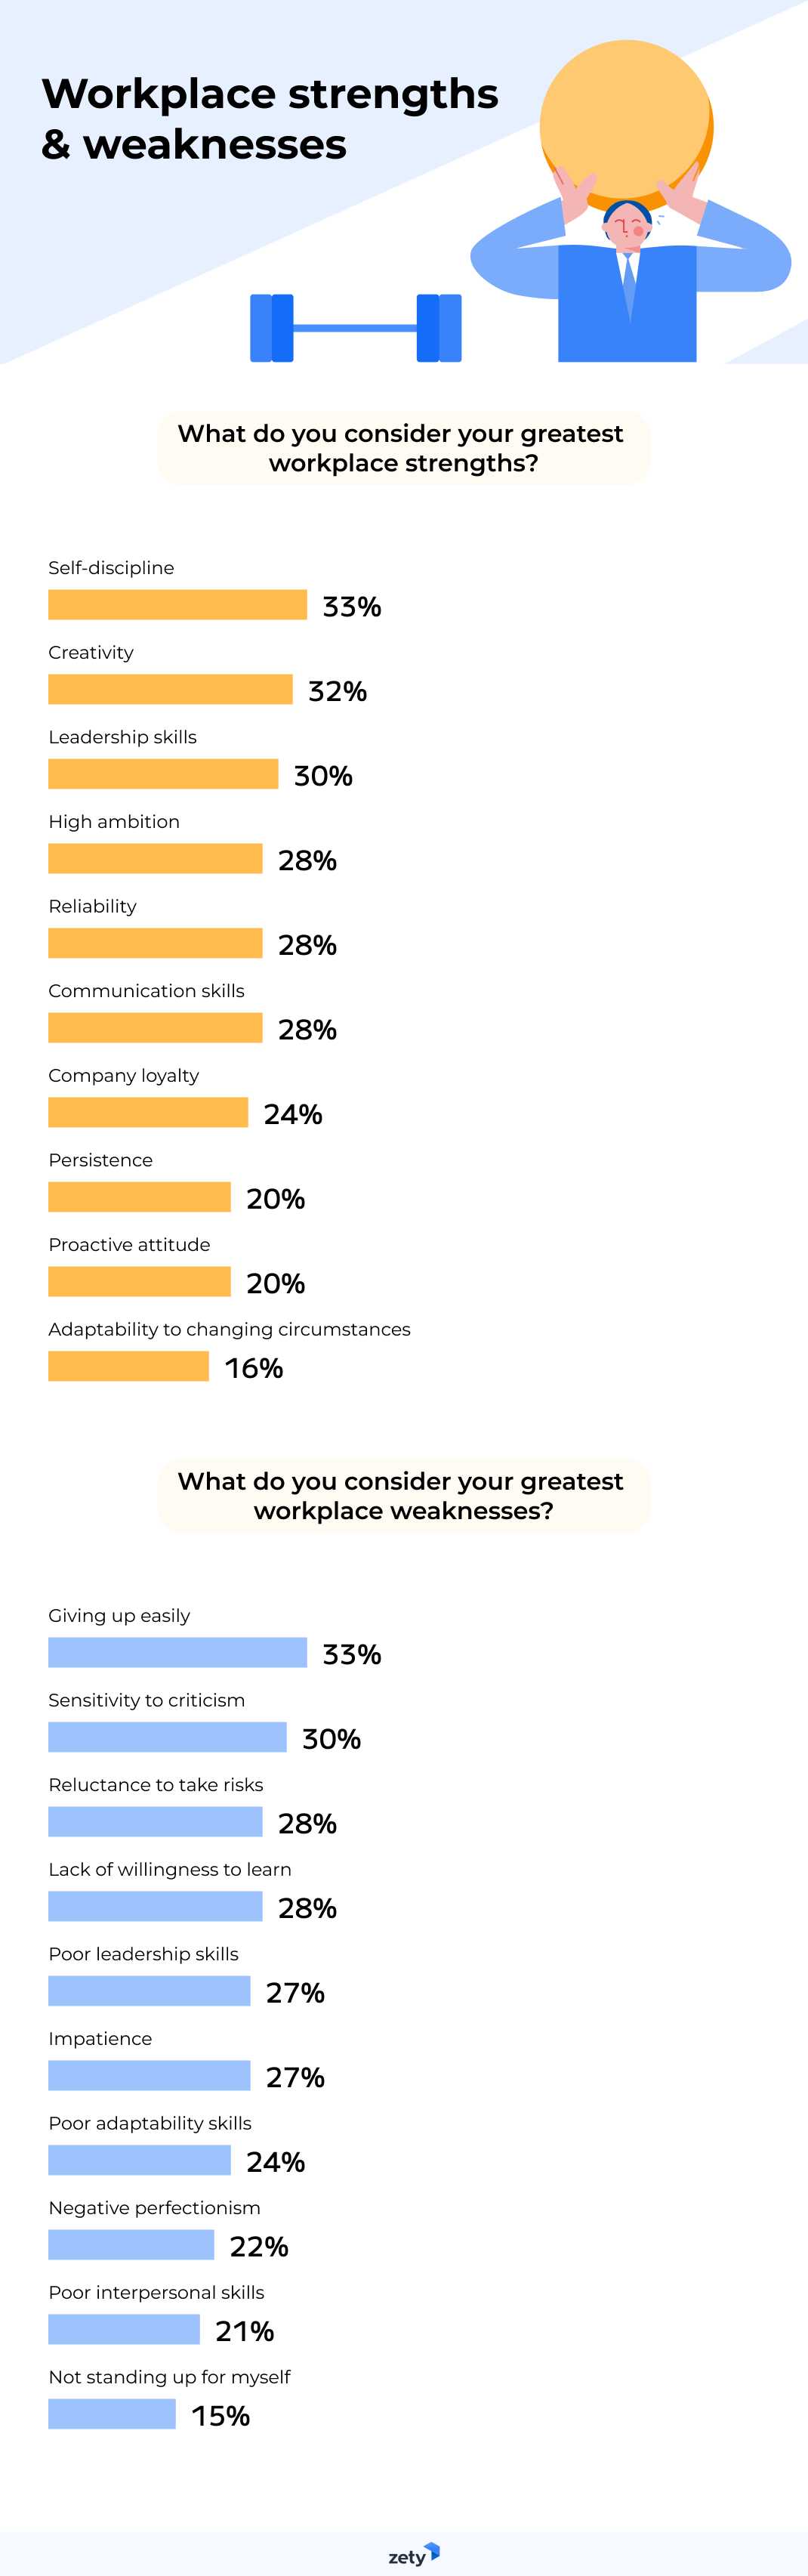
When asked, “What do you consider your greatest workplace strengths?” participants chose up to three options. Their answers were the following:
- Self-discipline – 33%
- Creativity – 32%
- Leadership skills – 30%
- High ambition – 28%
- Reliability – 28%
- Communication skills – 28%
- Company loyalty – 24%
- Persistence – 20%
- Proactive attitude – 20%
- Adaptability to changing circumstances – 16%
On the other hand, when reflecting on their greatest workplace weaknesses, respondents named:
- Giving up easily – 33%
- Sensitivity to criticism – 30%
- Reluctance to take risks – 28%
- Lack of willingness to learn – 28%
- Poor leadership skills – 27%
- Impatience – 27%
- Poor adaptability skills – 24%
- Negative perfectionism – 22%
- Poor interpersonal skills – 21%
- Not standing up for myself – 15%
Interestingly, A players and B players chose the same top 3 strengths, but the share of individual answers differed. Also, they shared two of the top 3 weaknesses.
A player's top 3 workplace strengths:
- Leadership skills – 31%
- Creativity – 29% | High ambition – 29%
- Self-discipline – 28%
B players' top 3 workplace strengths:
- Self-discipline – 37%
- Creativity – 34%
- Leadership skills – 32%
Conversely—
A players' top 3 workplace weaknesses:
- Giving up easily – 33%
- Sensitivity to criticism – 30%
- Impatience – 29%
B players' top 3 workplace weaknesses:
- Giving up easily – 33%
- Poor leadership skills – 32%
- Sensitivity to criticism – 31%
So there’s some overlap, but also notable differences.
Let’s move on to the evergreen topic of job satisfaction.
Job satisfaction under the microscope
Time to find out if there were noticeable differences in how A and B players felt about various aspects of their professional life.
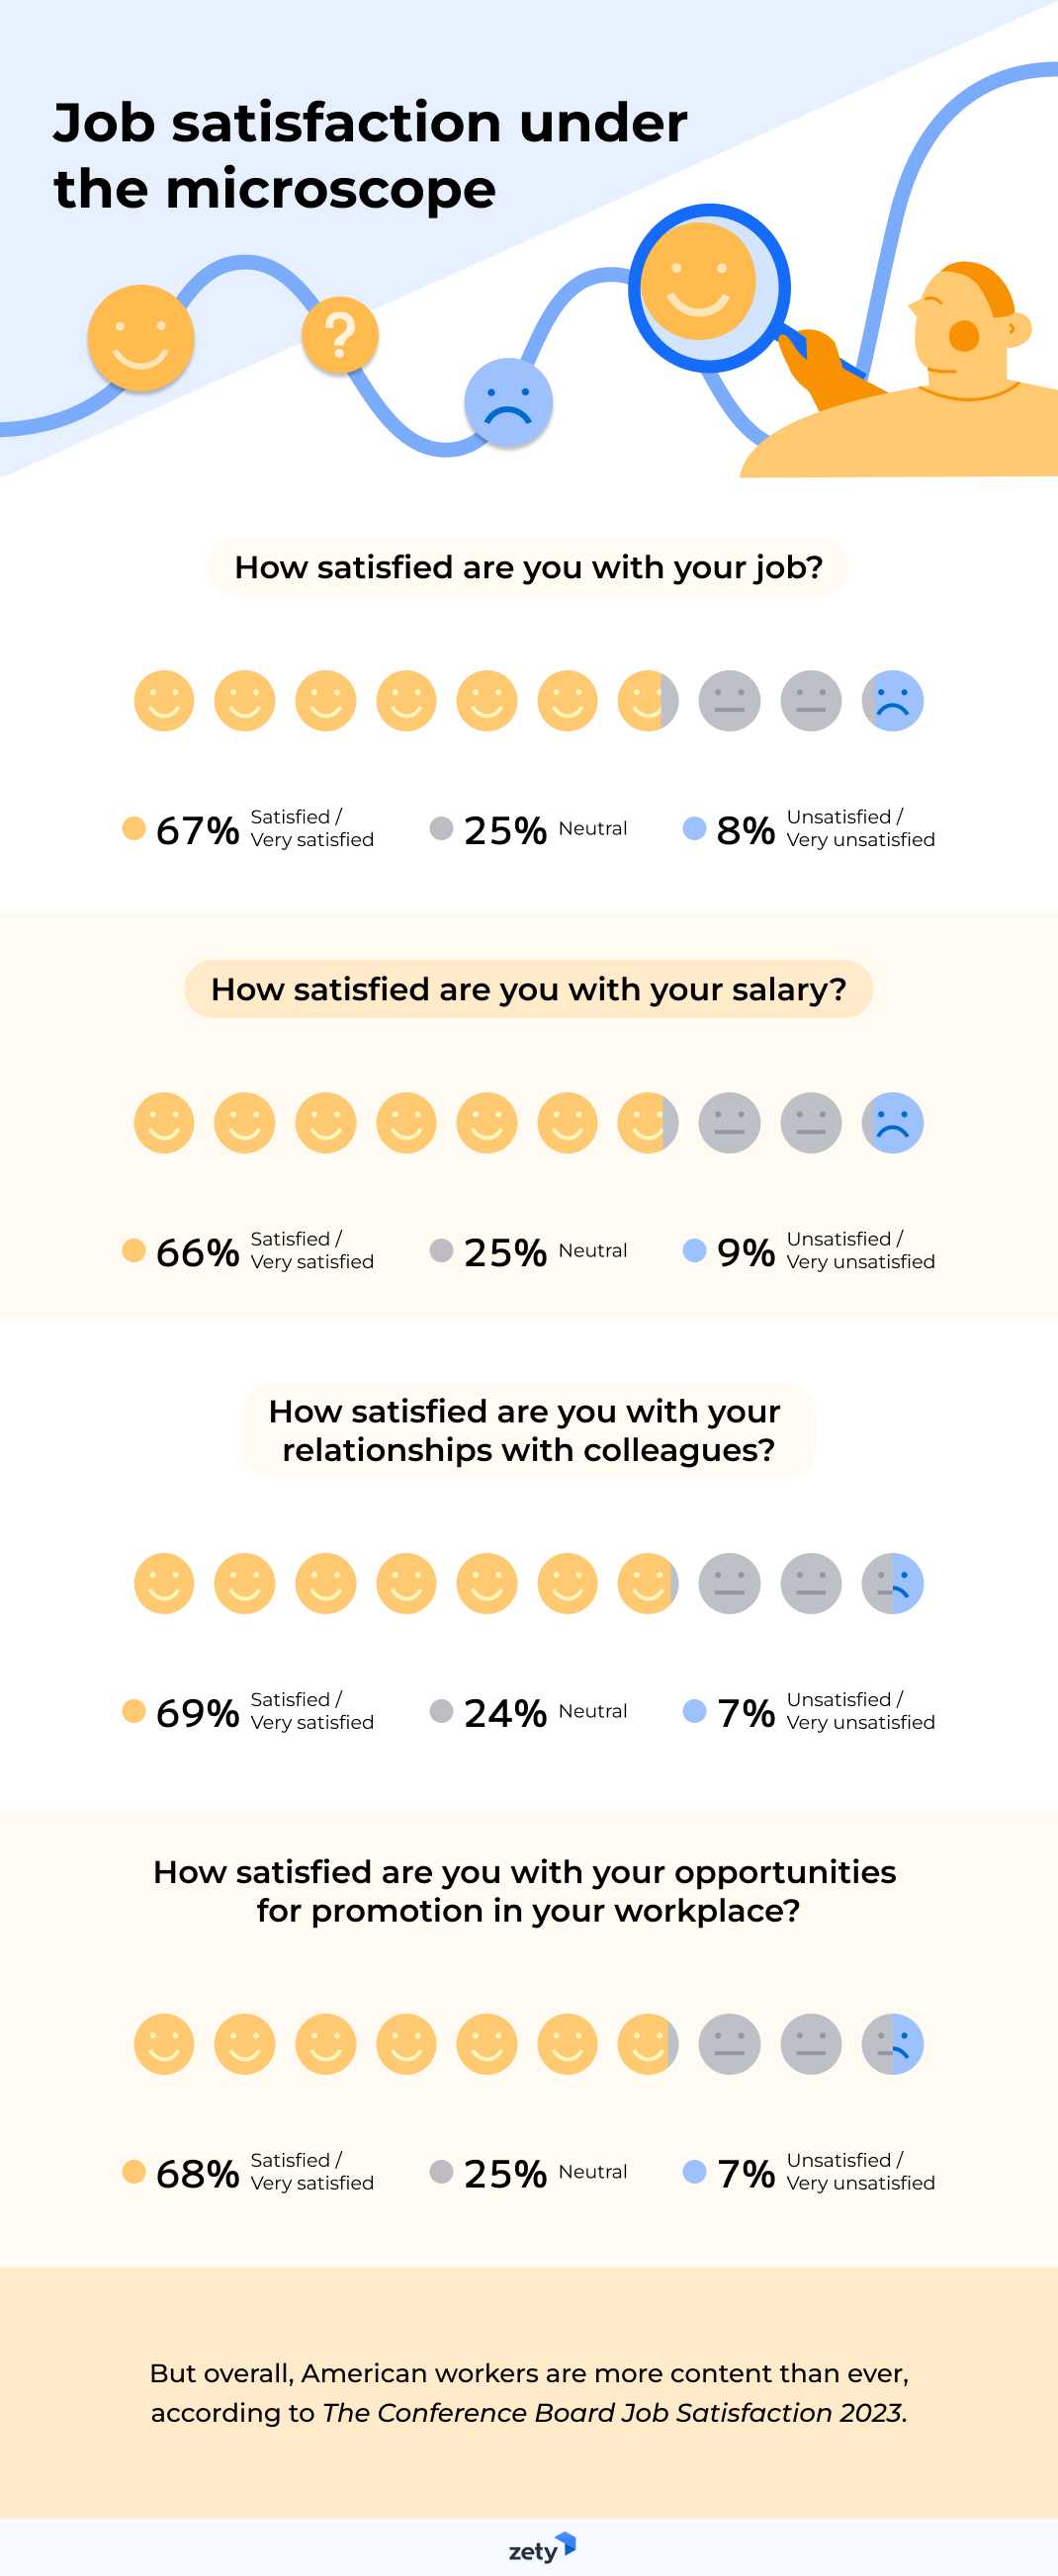
How satisfied are you with your job?
- Satisfied / Very satisfied – 67% [A players – 66% vs. B players – 69%]
- Neutral – 25%
- Unsatisfied / Very unsatisfied – 8%
How satisfied are you with your salary?
- Satisfied / Very satisfied – 66% [A players – 69% vs. B players – 66%]
- Neutral – 25%
- Unsatisfied / Very unsatisfied – 9%
How satisfied are you with your relationships with colleagues?
- Satisfied / Very satisfied – 69% [A players – 65% vs. B players – 72%]
- Neutral – 24%
- Unsatisfied / Very unsatisfied – 7%
How satisfied are you with your opportunities for promotion in your workplace?
- Satisfied / Very satisfied – 68% [A players – 66% vs. B players – 71%]
- Neutral – 25%
- Unsatisfied / Very unsatisfied – 7%
As you see, the differences weren’t striking.
A players were slightly more satisfied with their salary. In contrast, B players showed a significantly higher level of overall job satisfaction and greater satisfaction with their relationships with colleagues and opportunities for promotion.
But overall, according to The Conference Board Job Satisfaction 2023, American workers are more content than ever.
So—
Maybe it’s more a matter of the workplace atmosphere than what type of employee we are.
Mental health and work-life balance

Participants also answered a few questions about their mental health and work-life balance.
- 70% claimed they were satisfied or very satisfied with their work-life balance, 24% felt neutral, and 6% said they were unsatisfied or very unsatisfied.
- 83% of respondents believed that achieving professional success required personal sacrifice.
Digging deeper—
How far would they go for their careers?
For a successful career, I would sacrifice…
- my free time – 78%
- my hobbies – 79%
- my personal values – 77%
- my mental health – 77%
- my romantic relationship/marriage – 75%
Surprisingly, participants identifying as A and B players were almost unanimous. The differences in answers given by these two groups were minor.
Time to move on to another value-oriented issue: dilemmas most employees share.
Professional life priorities and dilemmas employees share
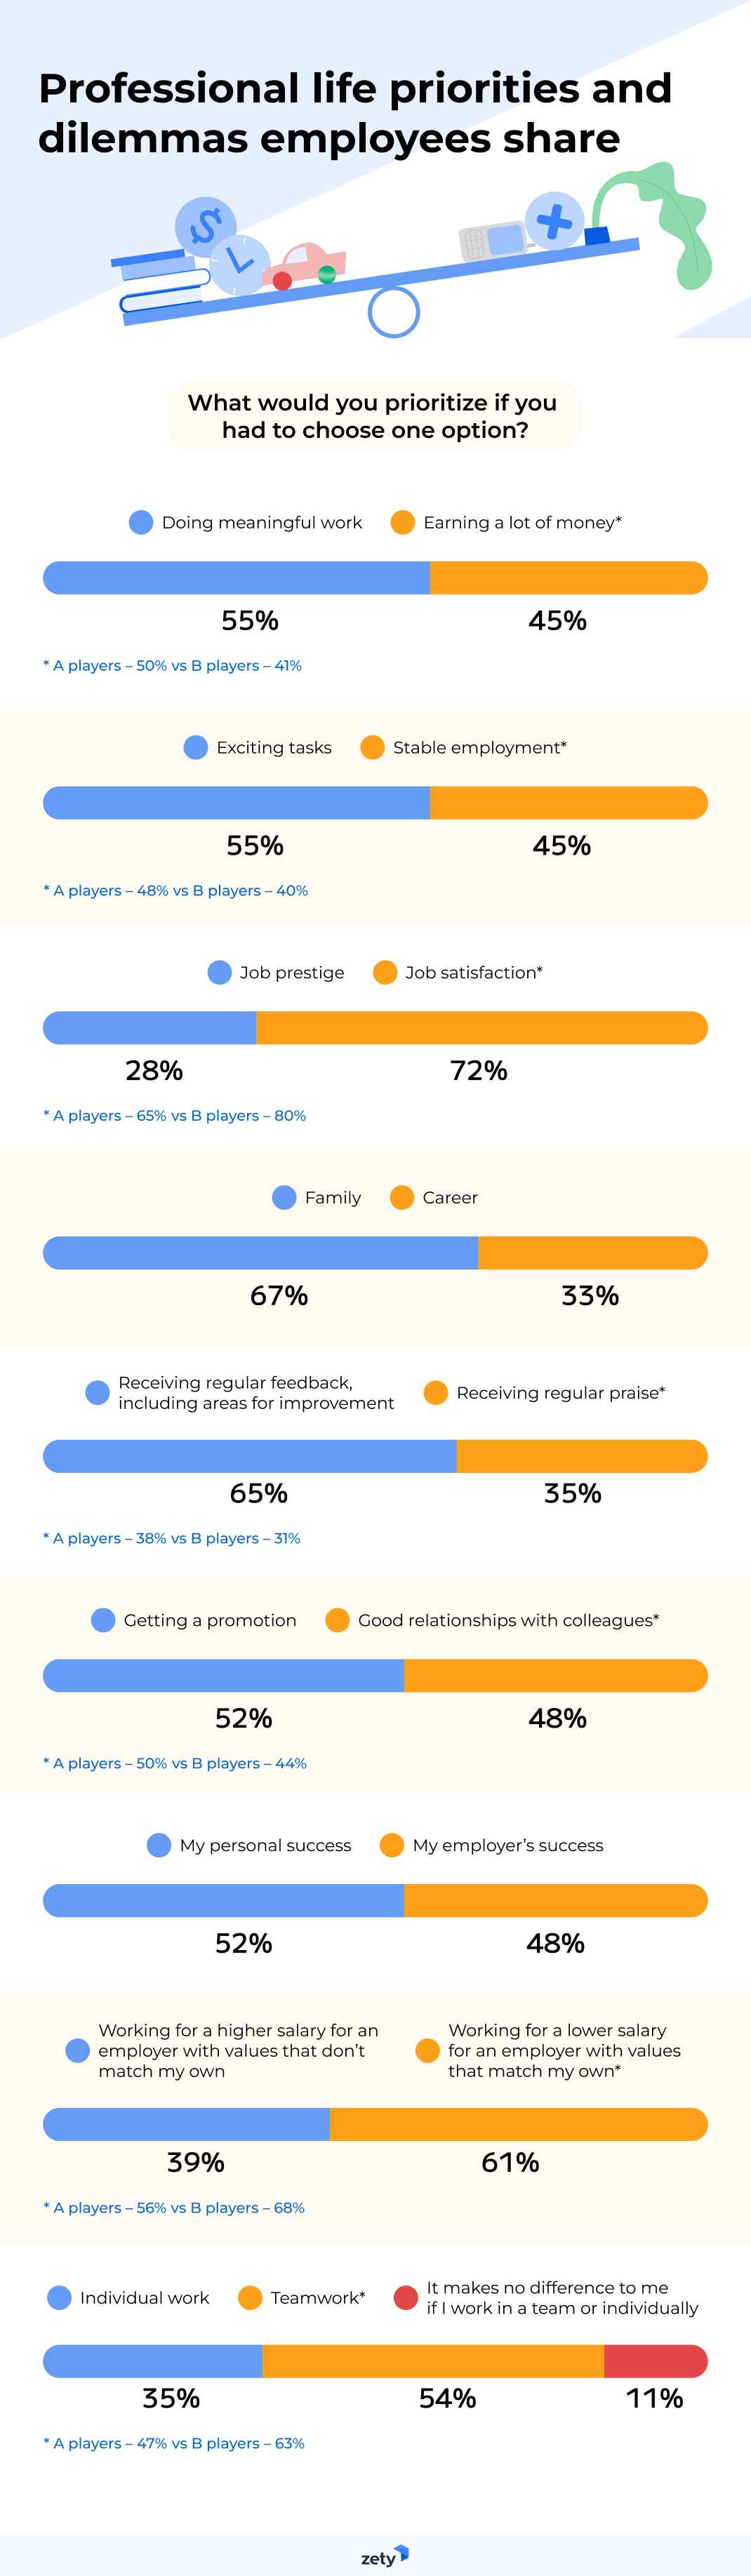
Participants were asked: “What would you prioritize if you had to choose one option?”. Here’s what they prioritize.
- Doing meaningful work—55% vs. earning a lot of money—45%
[money: A players – 50% vs. B players – 41%]
- Exciting tasks—55% vs. stable employment—45%
[stable employment: A players – 48% vs. B players – 40%]
- Job satisfaction—72% vs. job prestige—28%
[job satisfaction: A players – 65% vs. B players – 80%]
- Family—67% vs. career—33%
- Receiving regular feedback, including areas for improvement—65% vs. receiving regular praise—35%
[regular praise: A players – 38% vs. B players – 31%]
- Getting a promotion—52% vs. good relationships with colleagues—48%
[colleagues: A players – 50% vs. B players – 44%]
- My personal success—52% vs. my employer’s success—48%
- Working for a lower salary for an employer with values that match my own—61%
vs.
Working for a higher salary for an employer with values that don’t match my own—39%
[values over salary: A players – 56% vs. B players – 68%]
- Teamwork—54% vs. individual work—35% | It makes no difference to me—11%
[team: A players – 47% vs. B players – 63%]
Again, the conclusions aren’t as obvious as you might expect. Priorities go beyond the A/B binary.
Views on A players and B players at work
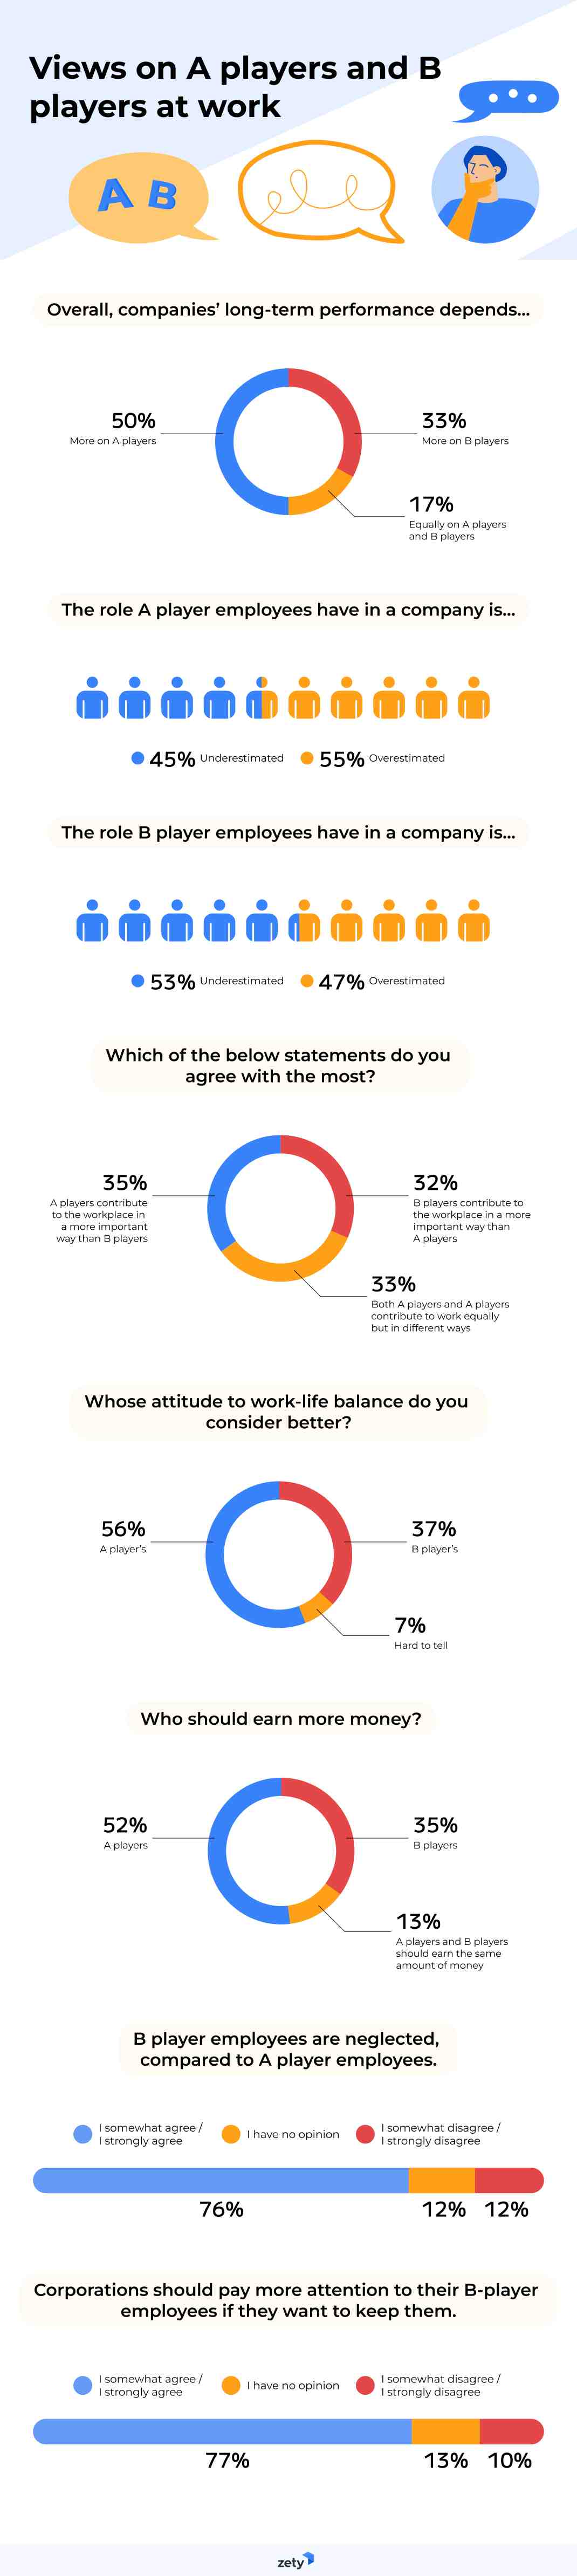
Let’s summarize our findings on A players and B players.
- 50% of respondents thought the long-term performance of employers depended more on A players, 33% said it depended more on B players, and 17% that it depended equally on both.
- 55% believed that A players’ impact was overestimated. At the same time, 53% claimed that B players’ impact was underestimated.
- Asked whose attitude to work-life balance was better, 56% chose A players’ and 37% B players’. For 7%, it was hard to tell.
- 52% thought that A players should earn more money, 35% B players, and 13% that both A and B players should have the same earnings.
- 77% agreed that corporations should pay more attention to their B-player employees if they want to keep them.
- 76% claimed B-players were neglected. Large corporation workers (501+ employees) were 1.8 times more likely to agree with such an opinion than those working for small companies (1–10 employees)—90% vs. 50%, conversely.
Now, the ultimate question—whose contribution to the workplace is considered more important? Let’s find out how respondents answered.
- A players contribute to the workplace more than B players – 35%
- B players contribute to the workplace more than A players – 32%
- Both A players and B players contribute to work equally but in different ways – 33%
That’s almost a three-way tie. No clear conclusions here.
What our study does show is that perception of A players and B players could be heavily influenced by stereotypes, our limited knowledge of the given topic, and, finally, the fact that being one or the other is not an inborn characteristic.
After all, the modern workplace is a team sport. And superstars need supporters as badly as supporters need superstars.
Working together, we can get further, grow stronger, and achieve more. The key to success is to know our strengths and weaknesses and celebrate opportunities for cooperation with others.
Methodology
The findings presented were obtained by surveying 1074 respondents online via a bespoke polling tool. They were asked questions about different types of employees. These included yes/no questions, scale-based questions relating to levels of agreement with a statement, questions that permitted the selection of multiple options from a list of potential answers, and a question that permitted open responses. All respondents included in the study passed an attention-check question.
Limitations
The data we are presenting relies on self-reports from respondents. Everyone who took our survey read and responded to each question without any research administration or interference. We acknowledge there are many potential issues with self-reported data, like selective memory, telescoping, attribution, or exaggeration.
Sources
- Buono, Ch., “The Value of B-Player Employees”
- Campbell Twohill, S., “How to Spot the B Players at Work”
- DeLong, T. J. & Vijayaraghavan, V., “Let’s Hear It for B Players”
- Elzinga, D., “A-Players Matter Less than C-Players at the Top Companies”
- Fonda, D., “It’s The B Team's Time To Shine”
- Gallup, “State of the Global Workplace: 2023 Report”
- Glazman, M., “5 Traits That Separate B-Players from A-Players at Work, and Signs to Look Out for When Hiring”
- Jouany, V. & Mäkipää, M., “8 Employee Engagement Statistics You Need to Know in 2023”
- Ladimeji, K., “5 Reasons To Hire a ‘B Player’”
- McKinsey & Company, “The State of Organizations 2023: Ten Shifts Transforming Organizations”
- Pendell, R., “The World’s $7.8 Trillion Workplace Problem”
- Quantum Workplace, “2023 Trends: Driving Employee Success”
- Quantum Workplace, “The Importance of Employee Recognition: Statistics and Research”
- The Baudville Blog, “A Players, B Players, and C Players: Appreciating the Differences”
- The Conference Board, “Job Satisfaction 2023”
- Walsh, J., “What’s an “A” Player?”
Fair use statement
Want to share the findings of our research? Go ahead. Feel free to use our images and information wherever you wish. Just link back to this page, please—it will let other readers get deeper into the topic. Additionally, remember to use this content exclusively for non-commercial purposes.
About us
Zety offers the best online resume builder on the market, plus expert advice on enhancing your resume. Learn about the best resume format. Discover how to write a job-winning cover letter, and get tips tailored to every career.
About Zety’s Editorial Process
This article has been reviewed by our editorial team to make sure it follows Zety's editorial guidelines. We’re committed to sharing our expertise and giving you trustworthy career advice tailored to your needs. High-quality content is what brings over 40 million readers to our site every year. But we don't stop there. Our team conducts original research to understand the job market better, and we pride ourselves on being quoted by top universities and prime media outlets from around the world.