Top HR Statistics & Trends for 2024
Create Your Resume Now
How many Americans will soon work remotely? Why do 72% of employees quit their jobs? Should we all consider reskilling soon?
I’ve gathered all these answers with links to external studies conducted by moguls such as Gallup, McKinsey, and Deloitte. Read on and see fascinating HR statistics!
This guide will show you:
- The ultimate collection of up-to-date HR statistics and facts.
- Recent HR technology trends and resume statistics.
- Remote work statistics, employee engagement statistics, diversity in the workplace statistics, and more!
Want to save time and have your resume ready in 5 minutes? Try our resume builder. It’s fast and easy to use. Plus, you’ll get ready-made content to add with one click. See 20+ resume templates and create your resume here.
Sample resume made with our builder—See more resume examples here.
Not quite what you’ve been looking for? Visit our other guides related to HR:
- Top HR Resume Examples
- HR Specialist Resume Examples
- HR Coordinator Resume Examples
- HR Generalist Resume Examples
- HR Manager Resume Examples
- Entry-Level HR Resume Examples
- HR Assistant Resume Examples
- Best HR Skills
- HR Cover Letter
General HR Statistics
Let’s start expanding our knowledge regarding the broad subject of HR statistics with some general insights you might find interesting.
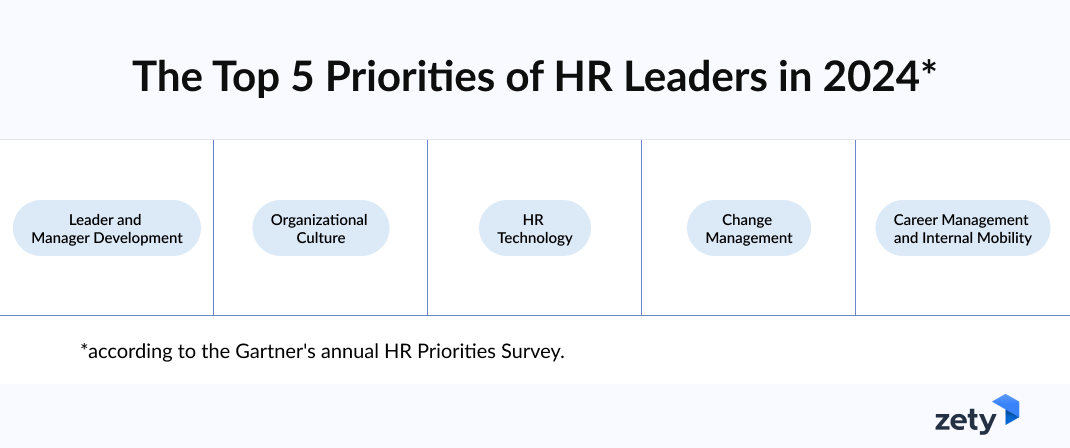
1. According to Gartner's annual HR Priorities Survey, the top 5 priorities of HR Leaders in 2024 include:
- Leader and Manager Development
- Organizational Culture
- HR Technology
- Change Management
- Career Management and Internal Mobility
2. 44% of employees said they experienced a lot of stress. This is the second year in a row that worker stress has reached record levels, according to Gallup’s report.
3. According to Mercer's Workforce 2.0 Global Talent Trends 2024 report, over 80% of employees are susceptible to burnout this year.
4. 86% of employees and job seekers rely on company reviews and ratings when determining where to apply for a job, according to a study conducted by Glassdoor.
5. At the beginning of 2024, 8,765,000 job openings in the USA were found on the Bureau of Labor Statistics website.
6. According to other Bureau of Labor Statistics data, aid vacation leave was available to 92 % of private industry workers in the largest establishments.
7. The same study shows that in establishments with 1–49 workers, 71% had that access, and in the state and local government of workers in the same amount of establishments, only 63% had it.
8. According to the IBIS World report, around a million HR employees are in the USA.
9. Data from the Society for Human Resource Management (SHRM) reveals that the average cost per hire is approximately $4,700.
10. Another Glassdoor study shows that employees and job seekers indicated that salaries (67%), benefits (63%), and location (59%) were among the top factors they considered in job advertisements.
Fascinating! And there’s more!
If you’re more interested in HR analysis, visit our study: Is HR Human?
Recruitment Statistics
Let’s talk about what interests not only recruiters but also candidates: the recruitment process.
1. According to a study conducted by Deloitte, by 2025, 75% of the workforce will be millennials.
2. LinkedIn report shows that career opportunities are the main reason people change jobs.
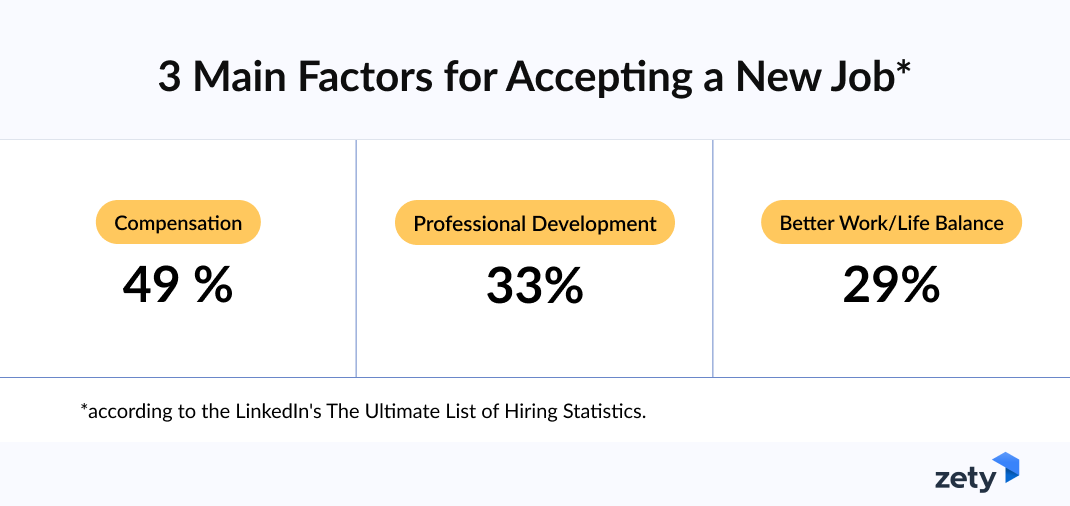
3. The same source shows the 3 significant factors for accepting a new job, which are:
- Compensation (49%)
- Professional development (33%)
- Better work/life balance (29%)
4. Research published by HR Grapevine states that 30% of new hires leave within 90 days.
5. Select Software Reviews claims that 94% of recruiters say using an Applicant Tracking System (ATS) has positively impacted their hiring process.
6. According to the CareerPlug research, 53% of job seekers have had a negative experience during the hiring process.
7. CareerPlug also states that 52% of candidates have declined a job offer because of poor recruitment experience.
8. According to research published by the ICIMS, 95% of candidates said that how a potential employer treats them as candidates will reflect how they will treat them as employees.
9. Last year’s Cronofy report shows that 49% of candidates left the recruitment process when it took too long to schedule an interview. It’s an 11% increase compared to 38% in 2022.
10. 51% of employees are watching for or actively seeking a new job, according to Gallup’s State of the Global Workplace: 2023 Report.
Recruitment is more than just filling vacancies—it's about finding the right fit. What recruitment challenges do you face, and how do you tackle them? Share your insights and experiences in the comments below!
Learn more about recruitment from our guide: Job Search Statistics.
Remote Work Statistics
Since the outbreak of the COVID-19 pandemic, remote work has been on the rise. What does it look like in numbers? What are the predictions, and how do people feel about working from home? Let’s take a look at some numbers!
1. Upwork study shows that 22% of the American Workforce will be remote by 2025.
2. According to the Gallup study regarding remote work, about 60% of employees with remote-capable jobs would like to work in a hybrid work arrangement, more than 30% prefer fully remote work, and less than 10% prefer to work on-site.
3. The same study finds that 80% of remote-capable employees believe virtual meetings are less effective or no different than in-person meetings.
4. Gallup also states that 76% of remote workers claim their companies will let them work remotely.
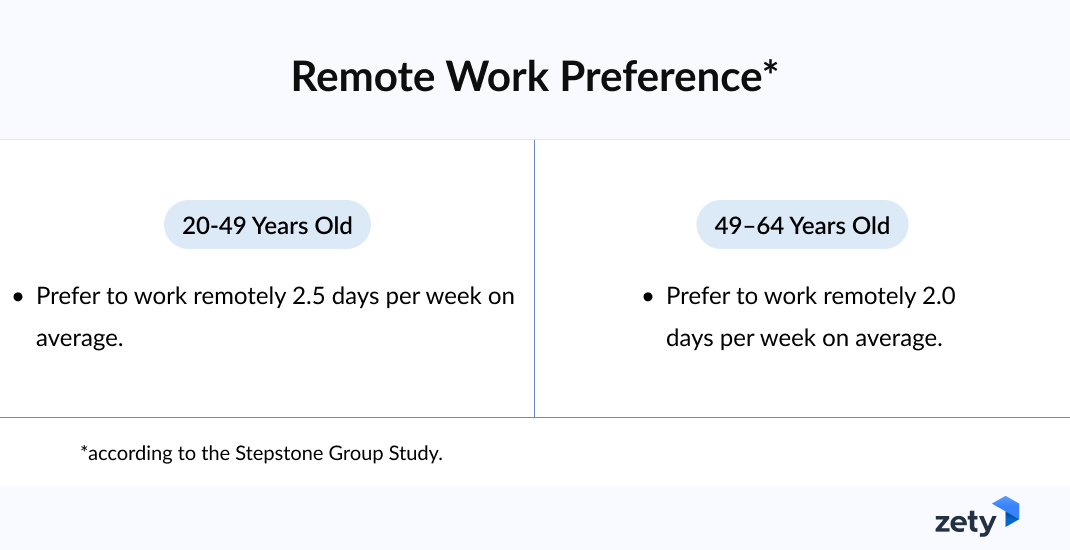
5. Younger and middle-aged employees (ages 20–49) have a stronger preference for remote work, wanting to work remotely 2.5 days per week on average, compared to older employees (ages 49–64) who prefer around 2.0 remote days per week, according to a study by The Stepstone Group.
6. ADP Research Institute conducted a People at Work 2022: A Global Workforce View study, which shows that 64% of the global workforce have already quit or would consider looking for a new job if the company required them to return to the office full-time.
7. According to Apollo Technical, 16% of global companies operate entirely remotely.
8. 29% of hybrid and remote workers would expect a pay increase if they were no longer able to work remotely, according to the Owl Labs’ 2023 State of Hybrid Work Report (United States) study.
9. Statista’s study finds that 43% of employees feel excluded in meetings. It’s also the most significant complaint regarding remote/hybrid work.
10. 58% of remote/hybrid workers feel more productive in their current work conditions, according to the McKinsey survey.
As you can see, remote work boosts productivity, and employees enjoy it more than working from the office. However, there are some downsides to working remotely. What do you think about it? Do you work from home? Let’s talk in the comment section below!
Looking for a remote job? Visit our guide: Best Online Jobs.
Employee Engagement Statistics
From the factors driving engagement to its impact on organizational success, let's explore the data to cultivate a thriving workplace culture.
1. Engagement has 3.8x as much influence on employee stress as work location, according to Gallup’s 2023 report.
2. Employee engagement is rising, reaching a record-high 23%, states the same source.
3. Highly engaged teams are 14% to 18% more productive than teams with low engagement, finds this Gallup article.
4. According to the Pew Research Center survey, about half (51%) of US workers who are not self-employed report being extremely or very satisfied with their job overall.
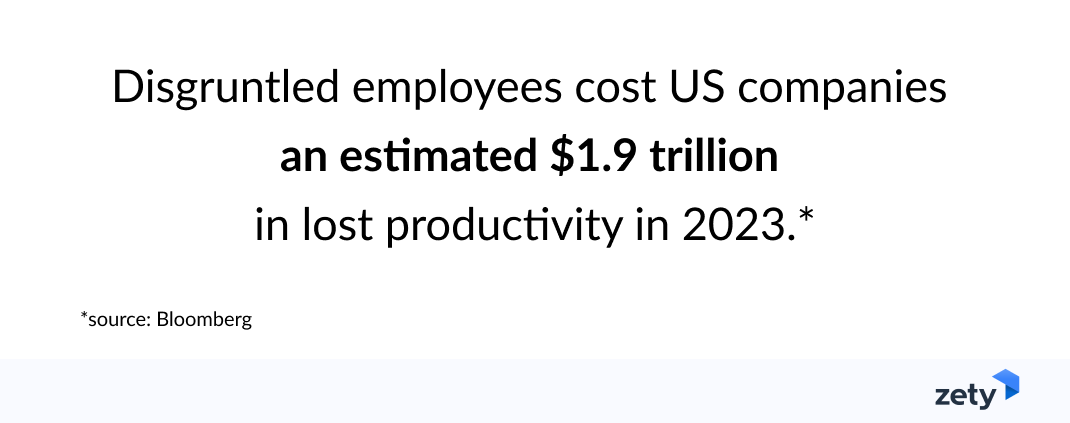
5. The Bloomberg article states that disgruntled employees cost US companies an estimated $1.9 trillion in lost productivity last year.
6. Haiilo engagement software claims that companies with high employee engagement are 21% more profitable.
7. A Harvard Business Review Analytic Services survey shows that 42% of respondents view engagement as a shared responsibility among managers, HR, and employees.
8. The same source shows that 56% of leaders claim their organization has achieved a positive return on investment thanks to their active approach towards employee engagement.
9. HBR also states that only 37% of leaders say that employee engagement is a significant area of focus for their organization today.
10. A recent Gartner study shows that no more than 16% of companies rely on modern technology to monitor their employees' engagement.
What strategies have you implemented to boost your engagement? Join the discussion and share your tips for fostering a positive work environment!
Do you want to know more about worker engagement and satisfaction? Visit our study, Satisfied Employees.
Employee Retention Statistics
Retention is key to building a stable and loyal workforce. But what factors influence employee turnover most? Let's find out.
1. A 2022 Toxic Work Environment Report shows that 72% of employees have quit due to toxic relations. More than 50% plan to do it for the same reason.
2. According to the Bureau of Labor Statistics, the U.S. average annual turnover rate equals 47%.
3. The average cost of replacing a salaried employee is 6 to 9 months of their average salary, states the PeopleKeep article.
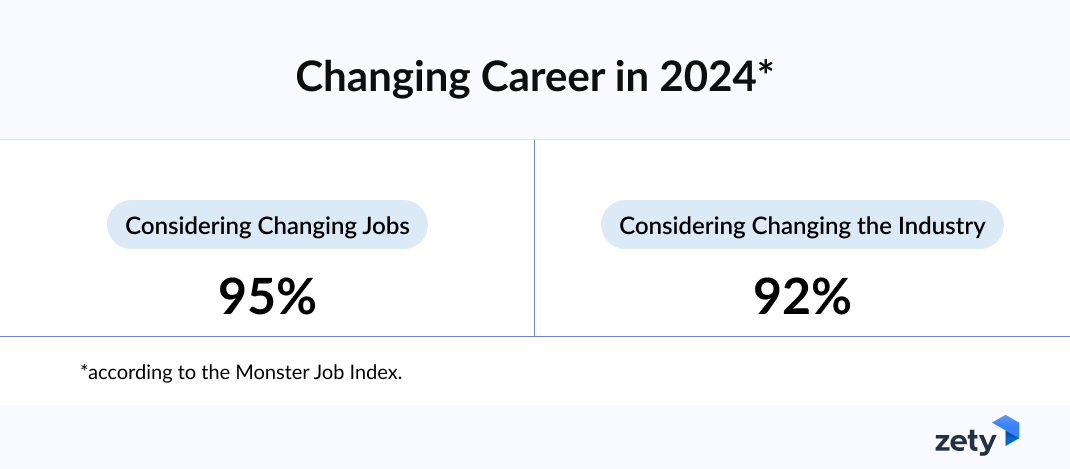
4. 95% of employees surveyed by Monster stated they’re considering changing jobs, and 92% said they are willing to switch industries.
5. The same source shows that 40% of workers report high employee turnover over the past year. Due to high employee turnover, their own workload is increasing.
6. The Jobvite’s Job Seeker Nation Report finds that 30% of workers have left a job within 90 days of starting.
7. Around 20% of new employees leave the company within their first 45 days, according to the O.C. Tanner data.
8. A study conducted by the DDI shows that 57% of employees quit because of their managers.
9. The number of job openings has decreased by approximately 14.98% from January 2023 till January 2024, according to the Bureau of Labor Statistics.
10. A LinkedIn Learning report found that 94% of employees would stay at a company longer if it invested in their career development.
What retention strategies have proven effective in your organization? Share your experiences and insights in the comments below!
There’s a tricky question you might face during a job interview. Find out how to answer it: Why Did You Leave Your Last Job.
Diversity and Inclusion in the Workplace Statistics
Diversity and inclusion are critical for fostering innovation and driving business success. But what do the numbers reveal about their impact on organizational performance?
1. According to PwC's Global Workforce Hopes & Fears Survey 2023, 54% of employees say that transparency is critical in diversity.
2. The same survey finds that 49% of employees feel confident that their employer is transparent regarding diversity in the workplace.
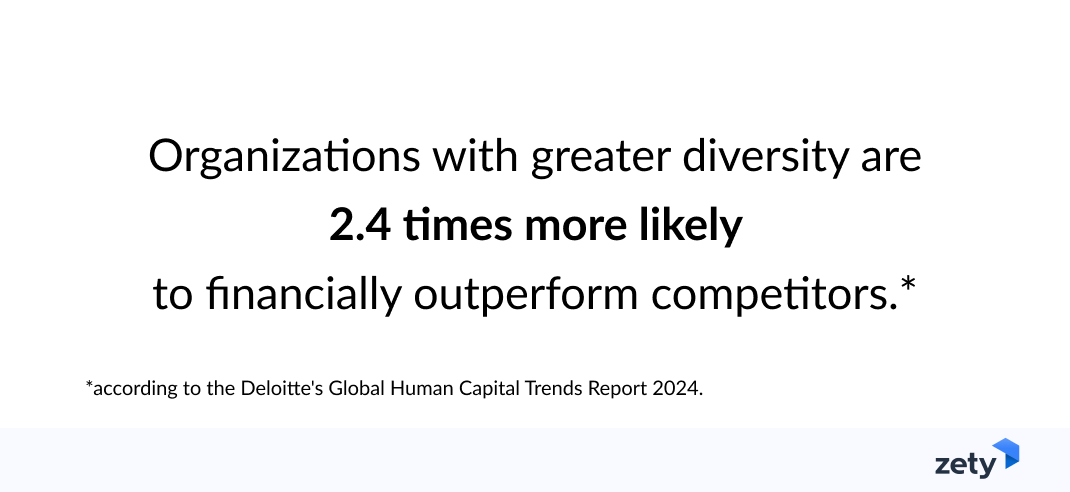
3. Deloitte's Global Human Capital Trends Report 2024 states that organizations with greater diversity are 2.4 times more likely to outperform competitors financially.
4. 74% of companies publicly advocate for workforce diversity, according to Mercer's Global Talent Trends Report 2023.
5. 70% of job seekers consider a company's diversity and inclusion efforts to be an important factor when looking for a new job, according to the PR Newswire article.
6. According to the SHRM Article, as of January 2023, female representation among CEOs in Fortune 500 companies stands at 10.6%.
7. Gallup’s study shows that only 41% of American managers were trained or educated about diversity, equity, inclusion, racial justice, racism, and other related topics.
8. 32% of job seekers wouldn’t apply to a company with a lack of diversity among its workforce, according to the Glassdoor study.
9. Only 8 companies from the Fortune 500 have a Black CEO.
10. According to the PEW Research Center, in 2022, American women typically earned 82 cents for every dollar earned by American men.
Creating an inclusive workplace culture is essential for attracting and retaining top talent. How does your organization prioritize diversity and inclusion initiatives?
Learn more about this important topic in our guide: Diversity and Inclusion Resume.
Resume & Cover Letter Statistics
Your resume and cover letter are your first impression for potential employers. But what do the statistics say about their effectiveness?
1. According to the Ladders, recruiters spend an average of 7.4 seconds looking at a resume.
2. The ERE article finds that the first resume lands in a recruiter’s inbox within 200 seconds after a job ad is posted.
3. Additionally, 470.000 resumes are posted weekly on the Monster job search website.
4. Glassdoor report shows that, on average, each corporate job offer attracts 250 resumes. Of those candidates, 4 to 6 will get called for an interview, and only one will get the job.
5. According to the Hired article, for every job opening, the company will typically interview between 4 and 20 candidates before making a hire
6. 91% of recruiters look mainly for soft skills on a resume, according to this LinkedIn article.
7. According to a study conducted by Resumelab, 37% of job seekers frequently lie on their resumes.
8. According to the Employer Preferences for Resumes and Cover Letters article, 56% of employers still want to see a cover letter with a resume.
9. However, according to the poll conducted by Arcadia University, this number can be as high as 83%.
10. 47% of job seekers don’t submit a cover letter for their current or last job application, according to Jobvite’s Job Seeker Nation Study.
11. According to Zety’s study, based on 11 million resumes created in the Zety Resume Builder, it takes around 15.25 minutes to create a resume.
Crafting a standout resume and cover letter can make all the difference in your job search. I’ve got plenty of resume tips for you. Do you have anything you’d like to share? Let’s discuss it in the comment section!
Learn more about how resumes look like in numbers: Resume Statistics.
Future of Work Trends
The future of work is evolving rapidly, driven by technological advancements and changing workforce dynamics. But what trends are shaping the workplace of tomorrow?
1. 70% of technology decision-makers say AI will be a critical support to HR functions—from candidate matching to career and skills development—over the next five years, according to Workday’s study.
2. However, the same study revealed that only 31% of decision-makers think employees are excited about AI in the workplace.
3. According to the Harvard Business School, over 90% of employers use machine learning to fill out or rank candidates.
4. Robin’s Office Space Report 2023 shows that 75% of companies plan to cut office space in 2024.
5. The global ATS market is expected to grow to $3.2 billion by 2026, according to the Go Hire article.
6. In 2023, merely 37% of employers opted to enhance their video meeting technology, according to the Owl Labs State of Hybrid Work 2023 Report.
7. In 2027, an estimated 86.5 million individuals are projected to be freelancing in the United States, constituting approximately 50.9% of the total U.S. workforce, predicts the Statista’s Number of freelancers in the United States from 2017 to 2028 report.
8. Gartner’s Future of Work Trends for 2024 report says that 63% of candidates rated a four-day workweek as the top future of work offering that would attract them to apply for a job
9. Gigonomics 2024: A Deep Dive into the Future of Gig Economy, a study conducted by Draup, projects that by 2027, more than 50% of the workforce in the United States will be engaged in the gig economy.
10. The World Economic Forum estimates that 50% of all employees will need reskilling by 2025.
The future of work holds exciting opportunities and challenges. How do you envision the workplace evolving in the coming years? I’d love to hear your thoughts on the future of work in the comments below; let’s chat!
Time to think about the future. Read our guide: Where Do You See Yourself in 5 Years?
Key Takeaway
Facts, figures, and HR statistics can put your job search into perspective. It’s good to know how fierce the competition is and what you’re up against, whether you're a recruiter or a job seeker. As a job seeker, it suddenly makes sense to put the effort and time into your resume when you know that hundreds of others also applied.
As for recruiters, knowing the numbers behind the job search can result in huge savings.
Either way, having a tangible sense of what it looks like to get a job in today’s market will give you the upper hand. And my HR statistics report is here to help.
Got any questions regarding what we’ve learned here today? Would you like to share some interesting insights? Reach out to me in the comment section below!
About Zety’s Editorial Process
This article has been reviewed by our editorial team to make sure it follows Zety's editorial guidelines. We’re committed to sharing our expertise and giving you trustworthy career advice tailored to your needs. High-quality content is what brings over 40 million readers to our site every year. But we don't stop there. Our team conducts original research to understand the job market better, and we pride ourselves on being quoted by top universities and prime media outlets from around the world.